🛒 Best Price Today on Amazon
Prime members get fast, free shipping on everything above, plus member-only deals. New members get a 30-day free trial — cancel anytime.
Checking how to check gpu memory junction temperature helps you identify VRAM overheating that ordinary GPU temperature readings can miss. HWiNFO and GPU-Z can display memory thermal sensors on supported graphics cards. This guide explains where to find the reading, how to monitor it while gaming, and what to do when it is unavailable.
What GPU Memory Junction Temperature Really Means
GPU memory junction temperature measures heat reported by sensors associated with the graphics card’s video memory. It is different from GPU core temperature and GPU hotspot temperature. Checking all three readings provides a more useful picture of thermal behavior, particularly during demanding games, high-resolution workloads, and extended sessions.
GPU Memory Junction vs. GPU Core Temperature
GPU core temperature represents the thermal reading associated with the graphics processor itself. It is the number commonly displayed in graphics monitoring overlays and manufacturer utilities. However, the GPU core and its surrounding memory chips do not necessarily heat up at the same rate.
Memory junction temperature provides additional information about VRAM thermal conditions. A graphics card can show a relatively moderate core temperature while its memory operates considerably hotter. This is why checking only the GPU temperature is insufficient when investigating possible VRAM overheating.
GPU Memory Junction vs. GPU Hotspot Temperature
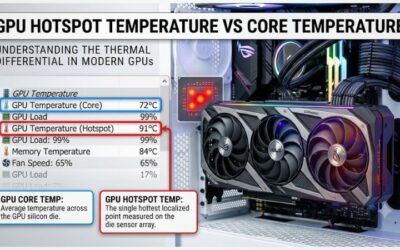
GPU hotspot temperature, sometimes called GPU junction temperature, describes the hottest measured region of the GPU die. It does not automatically represent the temperature of the video memory chips. Confusing these readings can lead to incorrect conclusions about graphics card cooling.
When monitoring your graphics card, look for separate entries such as GPU Temperature, GPU Hot Spot Temperature, and GPU Memory Junction Temperature. The exact labels depend on the monitoring application, graphics architecture, driver, and available sensor information.
Why Not Every Graphics Card Reports Memory Temperature
Not every graphics card exposes a readable VRAM temperature sensor to monitoring software. Availability depends on the GPU model, memory configuration, board implementation, firmware, and driver interface. Even graphics cards from the same product family can differ in the information their monitoring tools provide.
For example, NVIDIA’s GDDR6X-equipped GeForce models have historically offered more accessible memory temperature reporting than many standard GDDR6 models. Newer generations and software updates can change sensor availability, so check your specific card rather than assuming every model supports the same readings.
What Doesn’t Help
Looking at Task Manager’s GPU performance graphs does not reveal a dedicated memory junction temperature reading. Similarly, monitoring GPU core temperature alone cannot establish whether VRAM is overheating. These tools can provide useful performance information, but they do not replace a dedicated hardware sensor.
Avoid treating GPU hotspot temperature as a substitute for memory junction temperature. They measure different parts of the graphics card. If your monitoring application does not display a memory reading, repeatedly refreshing the overlay will not make an unsupported sensor available.
How to Check GPU Memory Junction Temperature: Step by Step
The easiest way to monitor VRAM temperature on Windows is to use HWiNFO64, which displays available hardware sensors in one interface. GPU-Z is another useful option for checking memory temperatures. The following methods help you identify the correct sensor, record peak readings, and distinguish unavailable data from an actual thermal problem.
Method 1: Check Memory Temperature Using HWiNFO64
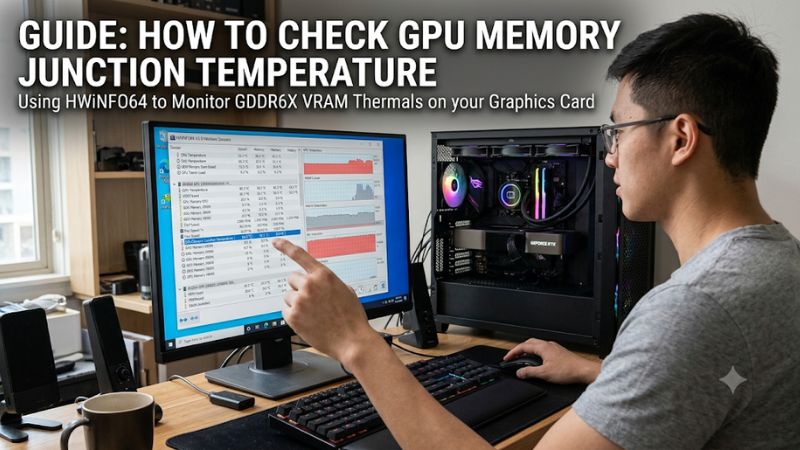
HWiNFO64 is a useful starting point because it provides detailed sensor information for supported graphics cards. Download the application from its official website, install or extract it, and launch it. Select Sensors-only when starting the program to open the hardware monitoring window directly.
Find your discrete graphics card in the sensor list and look for GPU Memory Junction Temperature, Memory Temperature, or a similar memory-specific entry. If available, the Current column displays the latest reading, while Maximum records the highest value observed since the sensor statistics were last reset.
Method 2: Use GPU-Z to Monitor VRAM Temperature
GPU-Z provides a simpler alternative when you only need graphics card information. Download the utility from TechPowerUp, launch it, and open the Sensors tab. Look for Memory Temperature or a clearly identified VRAM temperature sensor rather than relying on GPU Temperature or Hot Spot.
GPU-Z can also record sensor information to a log file, making it useful for investigating temperature changes during gaming. Enable sensor logging before starting your game, allow the graphics card to reach its normal operating conditions, and review the recorded values afterward. Sensor availability varies by graphics card and software version.
Method 3: Check AMD Radeon Temperature Readings
AMD Radeon users can start with AMD Software: Adrenalin Edition. Open the application and search for Performance Metrics. The available metrics include GPU Current Temperature and GPU Junction Temperature, along with GPU utilization, clock speed, fan speed, and other performance information.
Be careful when interpreting the results: AMD’s GPU Junction Temperature is not automatically the same as GPU Memory Junction Temperature. AMD’s official monitoring documentation identifies GPU Junction Temperature as a separate performance metric, so do not assume that this reading represents VRAM. Use a dedicated memory temperature sensor when your particular Radeon card exposes one.
AMD+1
Method 4: Check NVIDIA Memory Temperature with nvidia-smi
NVIDIA users can also inspect supported temperature readings through the NVIDIA System Management Interface. Open Command Prompt or a terminal with the NVIDIA driver tools available, then enter:
nvidia-smi -q -d TEMPERATURE
Review the temperature section for a Memory Current Temp entry. NVIDIA documents this field as the current GPU memory temperature, but explicitly notes that it is only available on supported devices. If the output does not include a memory temperature, this method cannot provide the missing reading.
NVIDIA Docs+1
How to Read and Monitor GPU Memory Junction Temperature
Finding the sensor is only the first part of the process. A single idle reading does not reveal how your graphics card behaves during demanding workloads. For a more useful assessment, compare temperature changes under gaming load, record the highest reading, and check whether performance changes alongside thermal conditions.
Step 1: Record Idle Temperature Before Gaming
Start by recording the memory temperature while your computer is relatively idle. Open HWiNFO64, locate the memory-specific sensor, and note its Current value. Also record GPU core temperature and hotspot temperature if available. This gives you a baseline for comparison.
Reset the sensor statistics before beginning a new monitoring session if you want a clean Maximum reading. Remember that background applications, room temperature, and fan behavior can influence the result. An idle reading alone should not determine whether your GPU cooling system is adequate.
Step 2: Monitor Temperature During a Gaming Session
Launch a demanding game and play using the resolution and graphics settings you normally use. Keep HWiNFO64 running in the background and monitor the memory temperature alongside GPU utilization, core temperature, and clock speed. A sustained gaming workload is more useful than checking a momentary temperature spike.
Allow enough time for the graphics card to reach its typical operating conditions. Different games place different demands on GPU memory, so one short session cannot represent every workload. Record the Maximum reading after playing and repeat the process with another demanding game if the results seem unusual.
Step 3: Compare Current, Maximum, and Average Readings
HWiNFO64 provides Current, Minimum, Maximum, and Average columns for supported sensors. Each serves a different purpose: Current shows the present condition, Maximum identifies the highest recorded value, and Average helps describe behavior over the monitoring period.
Use the Maximum column when checking whether VRAM becomes unusually hot during gameplay. However, do not treat one isolated peak as proof of overheating. Compare repeated sessions, GPU performance, and the manufacturer’s thermal specifications before deciding whether cooling needs attention.
Step 4: Investigate Missing or Unusually High Readings
If the memory sensor is missing, update your monitoring utility and check whether your exact graphics card model supports memory temperature reporting. Consult the manufacturer’s documentation or the monitoring application’s support information. Do not substitute GPU hotspot temperature or motherboard RAM temperature for VRAM temperature.
If the reading is consistently concerning, first inspect case airflow, GPU fan operation, and dust accumulation. Avoid immediately replacing thermal pads or disassembling the graphics card. Incorrect pad thickness or installation can interfere with cooler contact and potentially make thermal performance worse.
Temperature Monitoring Methods Compared
| Setting or Step | Where | Effect | Risk |
| HWiNFO64 monitoring | Sensors-only window | Displays available memory temperature and peak readings | Missing sensors on unsupported GPUs |
| GPU-Z monitoring | Sensors tab | Shows available GPU and memory sensor information | Sensor availability varies |
| AMD monitoring | Adrenalin > Performance Metrics | Displays supported Radeon performance metrics | Junction temperature may be confused with memory temperature |
| NVIDIA monitoring | nvidia-smi -q -d TEMPERATURE | Reports supported GPU and memory temperature fields | Memory temperature may be unavailable |
The most practical approach is to use HWiNFO64 for detailed monitoring and GPU-Z as an alternative when checking available sensor information. AMD and NVIDIA utilities provide additional options, but the readings depend on hardware and driver support.
Tom’s Hardware+2
FAQ
1. Can Every GPU Show Memory Junction Temperature?
No, not every GPU exposes a dedicated memory temperature sensor. Availability depends on the graphics card’s architecture, memory configuration, board design, firmware, and monitoring software support. If HWiNFO64 does not show the reading, check your exact GPU model’s specifications before assuming the sensor is defective.
2. Is GPU Hotspot Temperature the Same as Memory Junction Temperature?
No, GPU hotspot temperature measures the hottest monitored region of the GPU die, while memory junction temperature relates to video memory. Both readings provide different thermal information. You should monitor them separately whenever your graphics card exposes both sensors.
3. Can I Check GPU Memory Junction Temperature While Gaming?
Yes, provided your graphics card exposes the sensor and your monitoring software supports it. Run HWiNFO64 in the background or use GPU-Z logging to capture temperature changes during gameplay. Recording the Maximum value helps identify peaks that might not appear when you check the application after closing a game.
4. What Should I Do If My GPU Memory Temperature Is Too High?
First, compare the reading with the manufacturer’s thermal limits for your particular memory and graphics card. Then inspect fan operation, dust buildup, and case airflow. If temperatures remain excessive or performance is affected, consider professional inspection of the GPU cooler and thermal pads before attempting hardware modifications.
Final Thoughts
Knowing how to check gpu memory junction temperature helps you identify VRAM thermal issues that ordinary GPU monitoring can overlook. Start with HWiNFO64, record peak readings during demanding games, and compare them with your graphics card’s specifications. Investigate persistent thermal problems before considering hardware repairs.