🛒 Best Price Today on Amazon
Prime members get fast, free shipping on everything above, plus member-only deals. New members get a 30-day free trial — cancel anytime.
- Translate FPS into the experience you feel
- Create a capture that can be repeated
- Read the spike pattern before touching settings
- Determine whether the CPU or GPU is late
- Remove pacing conflicts
- Isolate background interruptions
- Check heat, clocks, and stability
- Follow a one-variable ladder
- Know when the answer is a patch or service
- Official references
- Top Pick: 8 Pcs Spikes License Plate Screws, Aluminum Cars Plate Frame Fastenings Bolt, Anti-Theft Kit, Anti-Theft Car Plates Frame Fastenings for Car Motorcycle
- Best Value: KAUEGOW 4 PCS Spike License Plate Screws for Car, Anti-Theft Spike Shape Auto Tag Frame Fastener, Cool Aluminum Alloy License Plate Fastening Screws for Truck Motorcycle SUV (Black)
- Premium Choice: Therwen 100 Pcs Yard Sign Stakes 24'' x 10'' H Frame Wire
Frame-Time Spikes: Diagnose and Fix Stutter
A smooth average frame rate can coexist with terrible stutter. At 60 FPS, an ideal frame arrives about every 16.7 milliseconds; at 120 FPS, about every 8.3 milliseconds. If most frames are timely but one takes 80 milliseconds, the average may still look respectable while the pause is obvious.
That is why a frame-time graph is the right starting point. It shows delivery consistency, not merely throughput. The fix depends on the shape and trigger of the spikes, so capture a small reproducible sample before changing settings.
As an Amazon Associate we earn from qualifying purchases at no extra cost to you.







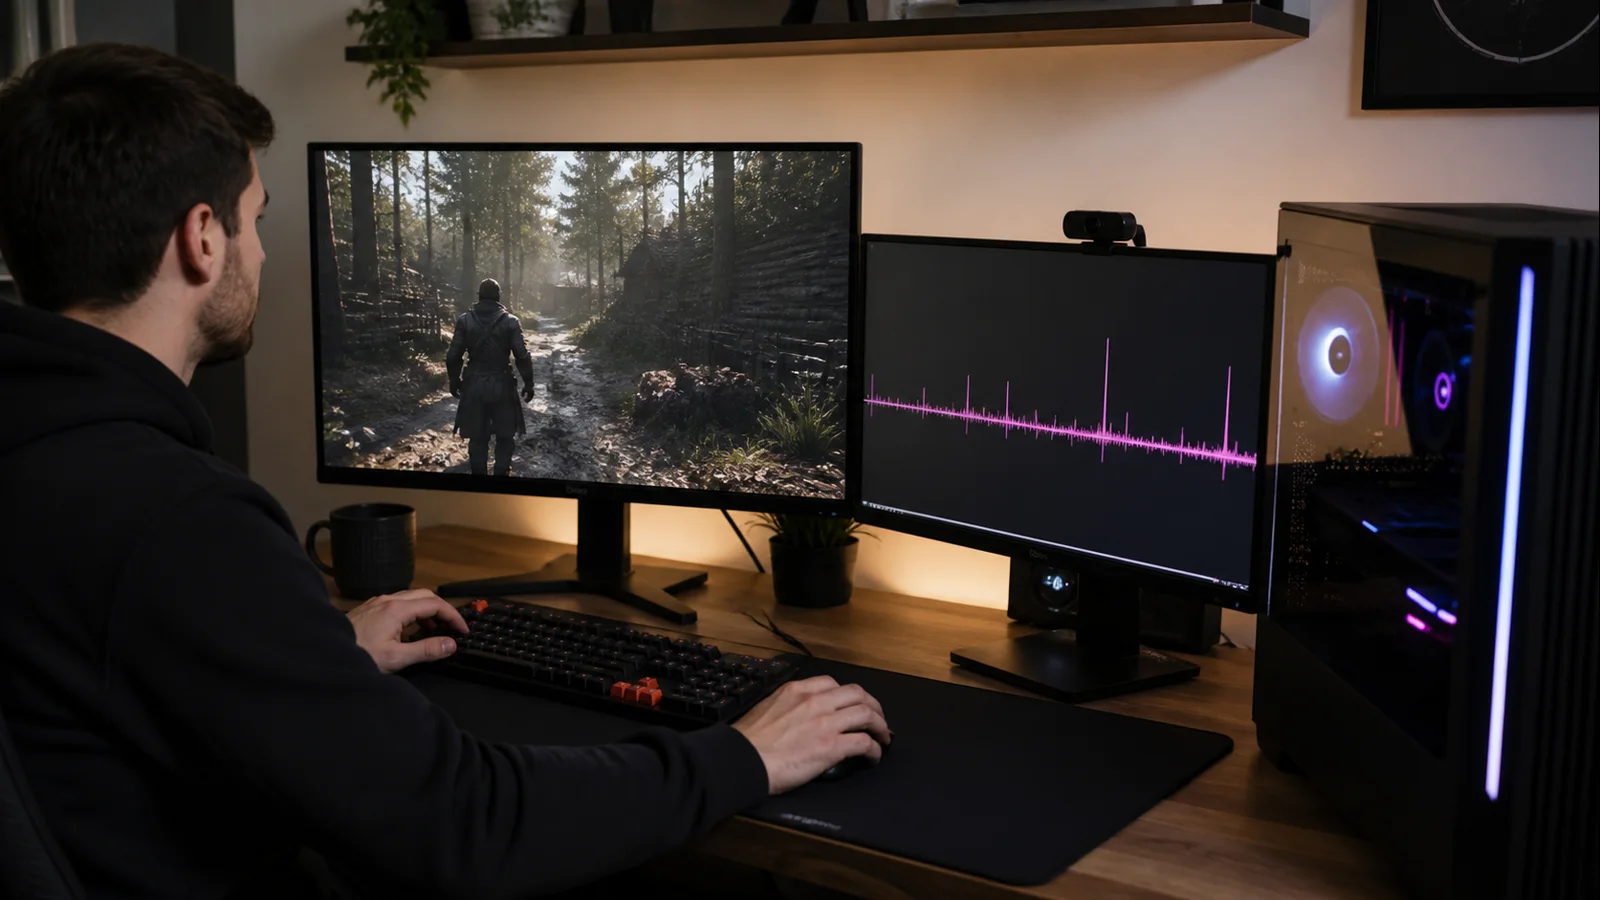
AI-created editorial illustration; not product photography or benchmark evidence.
Translate FPS into the experience you feel
FPS and frame time are reciprocal views of delivery rate: frame time in milliseconds is approximately 1000 divided by FPS. The relationship is nonlinear. A fall from 120 to 100 FPS changes the frame interval by about 1.7 milliseconds, while a single 50-millisecond frame is equivalent to a momentary 20 FPS interval. One average cannot describe both.
Look at the graph, a percentile summary, and the scene together. “One-percent low” values can summarize consistency, but the timeline tells you whether a spike occurred at an autosave, camera turn, explosion, map boundary, or background event.
PresentMon records per-frame CPU, GPU, and display timing metrics on Windows. Its documentation defines frame time as the time between frames on the CPU and provides related busy, wait, latency, and presentation measurements. Use one capture tool, because several overlays and loggers can interfere with the workload you are trying to observe.
Create a capture that can be repeated
Choose a 30-to-90-second route with a fixed start point. An in-game benchmark is useful if it reproduces the real symptom, but a manual route is better when the spike occurs only in play. Keep the same save, weather, camera path, and duration as closely as possible.
Before the baseline, record:
- Game build, graphics API, resolution, and graphics preset.
- Driver version and whether GPU or CPU tuning is active.
- Frame cap, V-Sync, variable refresh rate, and frame generation state.
- Temperatures, memory use, and optional background applications.
- The exact action or location associated with each visible hitch.
Run the route twice. A spike that appears only on the first encounter suggests compilation or cache warm-up. One that repeats at the same map boundary suggests traversal or asset streaming. A regular interval suggests a background task, polling utility, autosave, telemetry, or an engine timer. Random spikes under sustained heat suggest throttling or instability, but temperature must be observed rather than assumed.
Read the spike pattern before touching settings
Classify the graph into one of five patterns.
First-use spikes
A new effect or material hitches once, then its immediate replay is smooth. Shader or PSO compilation is plausible. Let the game’s precompilation finish and preserve valid caches. Do not keep deleting them.
Location-locked spikes
The same doorway, bridge, or camera turn hitches on every lap. Asset streaming, decompression, storage, world simulation, or a game-engine issue is more likely than one-time compilation.
Regular periodic spikes
Spikes separated by a similar interval can follow autosave, RGB or monitoring polls, wallpaper software, cloud sync, malware scans, or network status tasks. Close one optional utility per run and keep the route fixed.
Load-threshold spikes
Frame time worsens when GPU usage, VRAM pressure, system RAM, CPU temperature, or power reaches a threshold. Correlation is a clue, not a verdict. Lower one relevant demand and see whether both the threshold and spike move.
Pacing or cap oscillation
The graph alternates around a frame cap or synchronization boundary. Competing caps, V-Sync behavior, variable refresh range, or frame generation can disturb pacing even when average FPS is high.
For a symptom-oriented overview, compare these patterns with the causes in PC stuttering in games.
Determine whether the CPU or GPU is late
Start with a deliberately GPU-light test: reduce output resolution or enable a quality upscaler while leaving CPU-heavy settings unchanged. If the spike magnitude falls consistently, the GPU path or video-memory pressure deserves attention. If average FPS rises but the same spikes remain at the same locations, the cause may be CPU, streaming, storage, or engine work.
Then test one CPU-heavy setting, such as crowd density, simulation quality, or view distance. Restore the resolution first. If that single change improves the repeatable spike, the main thread or related CPU work may be late.
Telemetry can strengthen the inference. A long GPU-busy duration aligned with the spike suggests GPU work. A frame with long CPU busy time before GPU work begins points upstream. However, tools and APIs label metrics differently, and Hardware-Accelerated GPU Scheduling can affect some PresentMon GPU measurements. Read the tool’s current documentation and compare relative patterns on the same setup.
Do not conclude “CPU bottleneck” merely because total CPU use is 40 percent. A game can saturate one critical thread while other cores remain available.
Remove pacing conflicts
Return the game and driver control panel to a simple baseline. Use one frame limiter, not an in-game cap plus a driver cap plus an external limiter. Test V-Sync and variable refresh deliberately rather than toggling both along with the cap.
First, run uncapped briefly if temperatures and power are safe. Then choose a sustainable cap below the rate the system can hold in the test scene. A cap cannot repair a 100-millisecond streaming stall, but it can create headroom and reduce oscillation near full GPU utilization.
Test frame generation last. Generated frames can raise displayed smoothness without accelerating every simulation or input update. Make sure base rendering is acceptably paced first; otherwise the feature may make the counter look better while underlying spikes remain.
Isolate background interruptions
Perform a clean baseline with optional launchers, browsers, cloud synchronization, hardware dashboards, capture utilities, and RGB tools closed. Keep core Windows services, security software, and accessibility components intact. If the spikes disappear, reopen one application at a time.
Check Task Manager and Reliability Monitor around the captured timestamp. High disk activity, a process launch, or an application fault can explain a spike. Avoid generic “debloat” scripts and service-disabling lists. They change many variables, may weaken security, and can create new scheduling or update problems.
If storage-linked traversal spikes persist, verify game files, ensure free space is available, and check drive health using vendor-supported diagnostics. Do not move the game to another drive while also changing the graphics API; separate those experiments.
Check heat, clocks, and stability
Log CPU and GPU temperature and effective clocks during the route. A temperature number is meaningful only with the component’s behavior and specification. If CPU clocks fall as temperature reaches its limit and the same frame-time spikes appear, cooling or power limits may be involved. Review normal CPU temperatures while gaming before interpreting a single sensor.
Return CPU, GPU, and RAM tuning to validated defaults for diagnosis. That includes undervolts and memory profiles, not only obvious overclocks. Test the route again. A stable default result means the tune requires separate validation; it does not mean the game must tolerate an unstable setting.
Stop a run if temperatures rise abnormally, fans stop, artifacts appear, the display cuts out, or the PC resets. Repeated hard failures are not a useful benchmark.
Follow a one-variable ladder
Use the baseline between each branch:
- Capture the route twice with no changes.
- Close optional background and overlay tools.
- Lower resolution or enable quality upscaling only.
- Restore resolution; lower one CPU-heavy setting.
- Restore settings; use one sustainable frame cap.
- Compare one officially supported graphics API.
- Return hardware tuning to defaults.
- Verify files or compare a known-good official driver if timing supports it.
Write down the median behavior and the worst repeatable spike, but do not invent precision from one run. Confirm an improvement with at least two similar passes. If a change helps, reverse it once when safe; seeing the symptom return strengthens causality.
The broader game stuttering fix checklist can supply follow-up branches once your graph identifies the category.
Know when the answer is a patch or service
Report the issue to the game developer when the spike is locked to the same content on a clean supported configuration, appears across comparable systems, or follows a game update. Attach the route, save file if permitted, API, settings, driver, short capture, and whether the second pass improves.
Seek hardware service when several unrelated games show artifacts, driver resets, or hard shutdowns at stock settings across known-good drivers. Stop immediately for smoke, sparks, melted connectors, electrical odor, or loss of cooling. Unplug the PC and do not open a power supply.
The aim is not a perfectly flat synthetic graph. It is consistent delivery in the real scene, reached through a test whose result you can explain.
Official references
- GameTechDev: PresentMon official repository
- PresentMon: Capture application metric definitions
- Microsoft: WDDM Timeout Detection and Recovery