🛒 Best Price Today on Amazon
Prime members get fast, free shipping on everything above, plus member-only deals. New members get a 30-day free trial — cancel anytime.
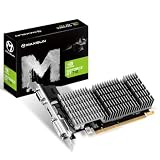
- Top Pick: maxsun GeForce RTX 3050 6GB Graphics Cards GDDR6 Video Graphics Card GPU for Gaming PC Mini Small Form Factor SSF Slim Low Profile Design PCI Express 4.0, HDMI 2.1, DisplayPort 1.4a
- Best Value: GeForce GT 610 2G DDR3 Low Profile Graphics Card, PCI Express 1.1 x16, HDMI/VGA, Entry Level GPU for PC, SFF and HTPC, Compatible with Win11
- Premium Choice: QTHREE GeForce GT 730 4GB Graphics Card,2X HDMI, DP,VGA,DDR3,64 Bit,Low Profile Video Card for PC,Computer GPU,PCI Express X8,SFF,DirectX 12,Support Winows 11
When your frame rate tanks but your GPU utilization sits at 30 to 50 percent, your graphics card is not the bottleneck. Something upstream is starving it. The GPU finishes its work, then waits idle while another component holds up the pipeline. This is one of the most common and misunderstood performance problems in PC gaming, and it affects every major engine — Unreal Engine 4 and 5, Unity, id Tech, and Frostbite all exhibit it under different conditions. The fix almost never involves your graphics card. It involves identifying what is actually preventing the GPU from receiving frames to render.
In 2026, with more titles shipping DirectX 12 and Vulkan by default, this symptom has become even more frequent because these APIs push more scheduling work onto the CPU. A stuttering frame rate paired with low GPU load now often means your processor cannot feed draw calls fast enough, or a storage subsystem is blocking asset streaming. Below is a methodical approach to isolating the real cause.
As an Amazon Associate we earn from qualifying purchases at no extra cost to you.





Likely Causes
| Cause | How to Confirm | Fix Difficulty |
|---|---|---|
| CPU bottleneck or single-thread saturation | Open Task Manager or HWiNFO; watch CPU utilization per core during a frame drop. If any core hits 95-100% while GPU sits below 60%, CPU is the limiting factor. | Low to Medium |
| VRAM overflow causing system RAM spillover | Monitor GPU memory usage in MSI Afterburner or the NVIDIA Control Panel overlay. If dedicated VRAM reads near capacity and total GPU memory spikes, assets are paging to system RAM. | Medium |
| Storage I/O starvation (texture/streaming stalls) | Check Windows Resource Monitor under the Disk tab during the lag. If read queue length exceeds 2.0 and the game’s process owns that activity, the drive cannot feed data fast enough. | Low to High |
| Background process contention (antivirus, overlays, updaters) | Run a clean boot (msconfig > Selective startup > disable all non-Microsoft services). If lag disappears, one of the disabled services is the culprit. | Low |
| Power plan or Windows GPU scheduling misconfiguration | Compare frame times under Balanced vs High Performance power plans. Also check Settings > Display > Graphics > Hardware-accelerated GPU scheduling toggle. | Low |
| Game engine setting forcing CPU-bound behavior (ray tracing, DLSS mode, physics) | Toggle the suspected setting off and watch GPU utilization rise immediately. | Low |
| Driver bug or corrupted driver state | Compare against a known-good driver version using DDU in safe mode. If the symptom follows one driver branch, the driver is the issue. | Medium |
Fix 1: Switch to a High Performance Power Plan
How to check
Press Win + R, type powercfg.cpl, and check which plan is active. Windows defaults to Balanced on most systems. A Balanced plan allows CPU cores to enter C-states aggressively, introducing micro-stalls during frame generation.
What to do
Select “High performance.” If the option is hidden, open Command Prompt as Administrator and run powercfg -setactive 8c5e7fda-e8bf-4a96-9a85-a6e23a8c635c. Also ensure that in Settings > System > Power, the “Power mode” dropdown under your selected plan is set to “Best performance.”
How to undo it
Return to powercfg.cpl and reselect Balanced. There is no risk to hardware from the Balanced plan.
Fix 2: Disable Background Processes and Overlays
How to check
During a lag spike, open Task Manager (Ctrl + Shift + Esc) and sort by CPU. Look for processes consistently using more than 3 percent CPU. Common offenders: Windows Defender real-time scanning, Discord overlay (the Discord.exe process with renderer threads), GeForce Experience in-game overlay, and Steam’s web helper (cef.exe child processes).
What to do
For a controlled test, press Win + R, type msconfig, go to the Services tab, check “Hide all Microsoft services,” then click “Disable all.” Restart. If lag resolves, re-enable services in batches to identify the specific one. For overlays, disable them at the application level: in Steam, right-click the game > Properties > General > uncheck “Enable the Steam Overlay while in-game.” In Discord, Settings > Game Overlay > toggle off.
How to undo it
In msconfig, go back to Services, re-enable everything you disabled, and restart. Re-enable overlays individually in each application’s settings.
Fix 3: Lower the Specific CPU-Bound Setting
How to check
While monitoring GPU utilization (MSI Afterburner with the on-screen display, or the Alt + R overlay on NVIDIA), toggle one setting at a time in the game’s graphics menu. The CPU-bound culprits are almost always: draw distance / view distance, particle quality, physics or simulation quality, and AI or crowd density. When you lower the correct setting, GPU utilization jumps and frames stabilize.
What to do
Reduce draw distance one notch first. It is the single most common CPU bottleneck in open-world titles because it directly increases the number of objects the CPU must cull and submit to the GPU. If that does not help, reduce physics or destruction quality (this is engine-specific: in Unreal titles, look for “Chaos Physics” or “APEX Destruction”; in Unity titles, check “Simulation Rate”).
How to undo it
Reset graphics settings to default within the game launcher or in the configuration file (typically located in %LocalAppData%\ or Documents\My Games\).
Fix 4: Verify Game Files
How to check
Corrupted or partially downloaded shader caches and asset bundles can cause streaming stalls that manifest as low GPU usage. If you recently moved the game folder between drives or had a disk error, this is more likely.
What to do
In Steam: right-click the game > Properties > Installed Files > “Verify integrity of game files.” In the Epic Games Launcher: click the three dots on the game tile > Manage > Verify. In Xbox App / Microsoft Store: click the game’s menu (three dots) > Manage > Verify and repair. These processes compare local file checksums against the server manifest and re-download only mismatched files.
How to undo it
No undo is needed. Verification only replaces files that are already broken or missing.
Fix 5: Change DirectX Version or Renderer Backend
How to check
Some engines ship with a choice between DX11 and DX12 (or Vulkan). DX12 shifts more work to the CPU for multi-threaded command recording, which can help or hurt depending on your processor. If your CPU has few cores (4 or fewer), DX11 may produce higher GPU utilization because the rendering path is simpler.
What to do
In Steam, right-click the game > Properties > General > look for “Launch Options” or a beta branch dropdown labeled “DirectX 11” or “Vulkan.” For games without a launcher option, edit the configuration file directly (search the game’s docs or community notes for the exact key, often something like RHI=Vulkan or Renderer=DX12). After changing, delete the shader cache folder if one exists (commonly %AppData%\ or the engine-specific path like %LocalAppData%\) to force a rebuild.
How to undo it
Revert the launch option or config key to its original value and restart the game.
Fix 6: Reinstall Graphics Drivers with DDU
How to check
Open Device Manager > Display adapters. Note your driver version from the Properties > Driver tab. Compare it against the latest release on the NVIDIA or AMD support site. A recent driver that introduced a scheduling regression can cause inconsistent utilization patterns that no other fix resolves.
What to do
Download Display Driver Uninstaller (DDU) from Guru3D. Reboot into Windows Safe Mode. Run DDU and select “Clean and restart.” After reboot, install the driver package you downloaded. For NVIDIA, a “Custom” install with “Perform a clean installation” checked achieves a similar result without DDU. Do this during a period when you are not actively relying on the GPU for work.
How to undo it
There is no meaningful undo short of installing a different driver version. Keep the .exe installer for the version you want as a rollback target.
If Nothing Works
If you have ruled out power plans, background processes, settings, file corruption, renderer backend, and driver state, the remaining possibilities are hardware-level: a failing or thermally throttled SSD, a CPU with degraded single-core performance due to aging or excessive background workloads from other software, or a motherboard/PCIe issue that is not producing obvious errors. At this point, test the game on a second machine if possible. If the lag persists identically, the issue is game-specific and you should report it with your configuration to the developer’s support channel or community forums. Include your exact CPU model, GPU, RAM amount, storage type, driver version, and a short capture from HWiNFO showing per-core CPU utilization during the stutter.
FAQ
Is low GPU usage always a problem?
No. If your frame rate is stable and well above your monitor’s refresh rate, low GPU usage simply means the GPU is not being taxed. The concern arises only when low utilization coincides with poor or inconsistent frame delivery.
Will more RAM fix this?
Only if your system is currently swapping to disk. Check Memory usage in Task Manager. If “In use” regularly exceeds the physical RAM amount and the page file is active on your storage drive, adding RAM will help. If you are sitting well below capacity, more RAM will not change anything.
Does this mean my GPU is failing?
Extremely rarely. A failing GPU typically produces visual artifacts, driver timeouts, or the device disappearing from Device Manager entirely. Low utilization with lag almost always points to a non-GPU bottleneck. Run a sustained benchmark (3DMark or Unigine Heaven) and compare your score against published results for your exact card and resolution. If it matches, the hardware is fine.
Should I overclock my CPU instead?
Overclocking addresses a CPU bottleneck by raising clock speed, so it can help if Fix 3 confirmed that your processor is saturated. However, it is not a diagnostic step. Establish the bottleneck first with monitoring, then decide whether overclocking is worth the thermals and potential instability for your specific situation.
Top picks from this guide
 GlortoGeForce GT 610 2G DDR3 Low Profile Graphics Card, PCI…$50 \xc2\xb7 99/100
 maxsunmaxsun GeForce RTX 3050 6GB Graphics Cards GDDR6 Video Graphics…$350 \xc2\xb7 99/100
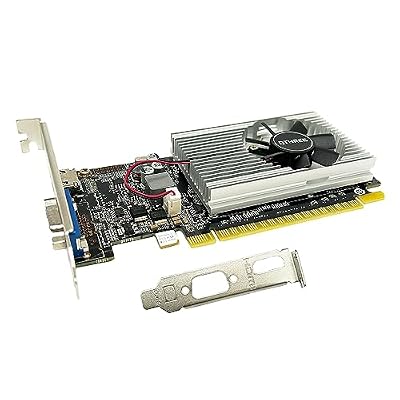 QTHREEQTHREE GeForce GT 210 Graphics Card,1024 MB DDR3 64 Bit,HDMI,VGA,Low…$38 \xc2\xb7 98/100
 QTHREEQTHREE GeForce GT 730 4GB Graphics Card,2X HDMI, DP,VGA,DDR3,64 Bit,Low…$90 \xc2\xb7 95/100