🛒 Best Price Today on Amazon
Prime members get fast, free shipping on everything above, plus member-only deals. New members get a 30-day free trial — cancel anytime.
- Allocated VRAM is not the same as resident VRAM
- Confirm that VRAM pressure is the symptom
- Change the highest-impact variable first
- Treat resolution scaling carefully
- Remove hidden memory consumers
- Handle caches and drivers conservatively
- A practical test worksheet
- When to stop adjusting settings
- Official references
High VRAM Usage: What It Means and How to Fix It
A nearly full VRAM meter is not automatically a problem. Modern games often keep textures and other resources available because unused memory provides no benefit. The important question is whether the game exceeds its practical video-memory budget and begins evicting or transferring resources often enough to cause stutter, texture pop-in, severe slowdown, or crashes.
Before lowering every setting, identify what the number represents. Monitoring tools, game overlays, and operating-system panels may report different scopes and different kinds of memory. Two readings can disagree without either being broken.
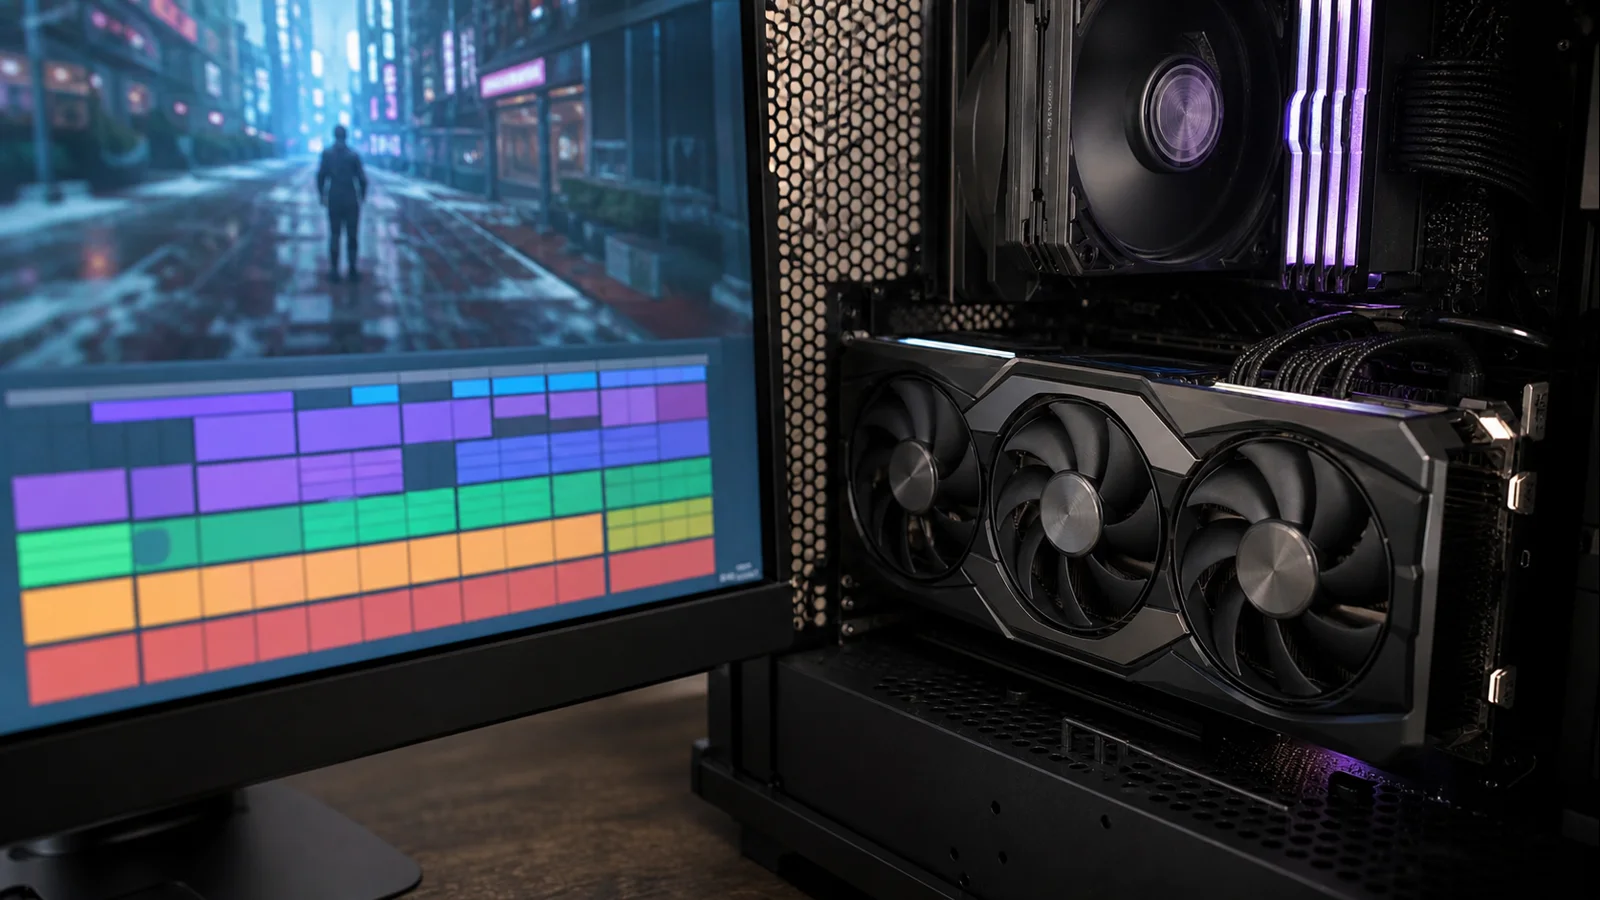
AI-created editorial illustration; not product photography or benchmark evidence.
Allocated VRAM is not the same as resident VRAM
Allocation is memory an application has requested or reserved in its address space. Residency describes resources currently backed by physical video memory and available to the GPU without being brought in again. A game can allocate a large pool up front, keep it for reuse, and still operate smoothly. That high allocation is not equivalent to actively touching every byte each frame.
Windows also manages a video-memory budget rather than promising one application every physical byte printed on the graphics card box. Microsoft’s DXGI documentation exposes values such as Budget and CurrentUsage. Its Direct3D 12 residency guidance says that the budget can fluctuate when background processes wake, sleep, or when the user switches applications. Going over budget can lead to intermittent pauses or allocation failures as the system manages competing work.
This produces three useful categories:
- High allocation, smooth play: usually normal caching or pooling; no fix is required.
- Usage near the budget with repeatable hitches: possible memory pressure, especially if lowering texture demand helps.
- Rising usage that never stabilizes, followed by degradation: possible game, mod, overlay, or driver leak; restart and isolate the trigger.
Dedicated GPU memory and shared GPU memory are also different. Shared memory is system RAM that Windows can make available to graphics workloads. It is not a speed-equivalent extension of local VRAM. Seeing shared usage increase alongside stutter can support a pressure diagnosis, but the number alone is not proof.
Confirm that VRAM pressure is the symptom
Choose a repeatable in-game route that includes the hitch. Record resolution, texture setting, ray tracing, upscaler mode, installed texture packs, and all mods. Close browsers, video editors, hardware-accelerated launchers, and other optional GPU-heavy programs. Keep the driver and game version unchanged.
Watch three things together: the memory reading, frame-time behavior, and visible asset quality. A compelling VRAM-pressure pattern looks like this: the scene fills memory, frame times spike during camera movement or traversal, textures arrive late, and reducing a memory-heavy setting materially improves the same route.
Do not use average FPS alone. A game can average 80 FPS while pausing briefly whenever it streams a new group of textures. Those pauses are what the player feels.
If you need a broader diagnosis first, use this game-stuttering troubleshooting guide to rule out CPU, storage, network, and shader-related causes.
Change the highest-impact variable first
Texture quality is usually the cleanest first test because it strongly affects memory demand while often having a smaller performance cost than lowering resolution. Reduce textures by one preset, restart the game if its menu says a restart is required, and repeat the same route.
If the result is unchanged, restore textures before changing another item. Then test one of these, individually:
- Disable an optional high-resolution texture pack.
- Reduce ray-tracing texture or geometry quality if separately exposed.
- Lower shadow-map quality one step.
- Reduce view distance or geometry detail one step.
- Lower the output resolution or use a quality upscaling mode.
The exact memory cost is engine-specific. Resolution affects render targets and buffers; texture quality affects mip selection and asset pools; ray tracing can add acceleration structures and other resources. Avoid universal claims such as “shadows always use more VRAM than textures.” Your controlled comparison is more useful than a generic ranking.
Treat resolution scaling carefully
Upscaling can reduce the internal rendering resolution while preserving the monitor’s output resolution. This may lower the size of some render targets and reduce GPU work, but it does not necessarily shrink the game’s texture pool by the same proportion. If ultra textures are the limiting factor, changing from native rendering to a quality upscaler may help less than lowering textures one notch.
Frame generation can also add memory and scheduling overhead in some implementations. Test it separately from upscaling. First establish a stable base with frame generation off, then enable it as the only change.
For planning a future build, compare workloads and target resolution rather than buying from a single “VRAM used” screenshot. This guide to how much VRAM games need explains capacity in context, while these 1440p GPU considerations help connect memory with total GPU capability.
Remove hidden memory consumers
Overlays, browsers, wallpaper applications, capture software, and video playback can consume GPU resources. Close them for a baseline, but do not disable security protections or essential accessibility tools. If usage falls and the hitch disappears, restore one application at a time.
Mods deserve special attention. High-resolution texture packs, model replacements, extended draw distance, reshades, and ray-tracing modifications can push a configuration beyond the game’s intended memory tiers. Disable all mods, verify the game files, and test a clean save or known location. Add mods back in small groups, then individually near the failure.
Multi-monitor setups can contribute some GPU-memory use, particularly with high-resolution displays and video on a secondary screen, but they rarely justify panic by themselves. Test with secondary video and accelerated applications closed before physically disconnecting displays.
Handle caches and drivers conservatively
Do not clear shader caches because a VRAM meter is high. A disk shader cache is not the same thing as physical video memory residency, and clearing it can create compilation stutter on later launches. Clear a game cache only when the developer or GPU vendor recommends it for a specific corruption symptom.
If the issue began after a driver update, reset the driver’s global and per-game settings, then compare a stable official driver with the current release. Keep game settings fixed during the comparison. A driver reinstall may fix incorrect state or reporting, but repeatedly cleaning drivers is not a substitute for demonstrating a version-specific change.
Also distinguish a display bug from real pressure. If one overlay reports 15 GB “allocated” while Windows shows a lower current dedicated usage and the game is smooth, the overlay may be showing a pool or application request. Use labels, not just numbers.
A practical test worksheet
Create five columns: change, memory before, memory after, frame-time symptom, and visual cost. Run the same route after each single change. A useful sequence is:
- Baseline with optional background GPU apps closed.
- Textures one step lower.
- Baseline textures restored; high-resolution pack disabled.
- Pack restored; ray tracing disabled.
- Ray tracing restored; quality upscaling enabled.
- Base settings restored; all mods disabled.
Restart the game between tests when it does not release resources cleanly or when the menu requires it. Do not compare a freshly loaded route with a two-hour session and call the memory difference causal.
When to stop adjusting settings
Stop if high usage is not accompanied by any symptom. A full-looking allocation graph during smooth, stable play needs no repair.
Escalate to the game developer when clean settings and supported hardware show memory growth across repeated scene loads, performance degrades until restart, or a reproducible crash occurs at a specific action. Include logs, settings, resolution, driver version, and a minimal reproduction without mods.
Seek hardware service if multiple known-good games show corruption or artifacts at stock settings, dedicated memory errors are reported by vendor diagnostics, or crashes persist across clean drivers and sensible settings. Stop immediately if the card overheats, emits an electrical smell, or shows physical damage. Do not continue stress testing a suspect board merely to fill the graph again.