Affiliate disclosure: As an Amazon Associate we earn from qualifying purchases. This post contains affiliate links — we may earn a small commission at no extra cost to you. This never affects our picks. Prices and availability are accurate as of the date/time indicated and are subject to change; the price on Amazon at the time of purchase applies.
- What the Community Says You Need
- Step 1: Members Always Start With Documentation
- Step 2: BIOS Update and Optimized Defaults
- Step 3: The Community Approach to AMD: PBO + Curve Optimizer
- Step 4: The Community Approach to Intel: Per-Core Ratios and LLC
- Step 5: Stress Testing the Community Way
- Step 6: Community RAM Tuning
- Step 7: GPU Baseline (Community Method)
- Step 8: GPU Memory First (Community Convention)
- Step 9: Modest Core Overclock + Undervolt Combo
- Step 10: Long-Form Validation
- Common Community Pitfalls
- Pro Tips From Community Veterans
- Community-Recommended Products
- Frequently Asked Questions
- Conclusion
- Related Guides
- Related Articles
- Editor’s Top Picks for GPUs
- At a Glance: Quick Comparison
- About the Author
- Related Articles
This guide is a synthesis of what our community has tested and shared in the PCGU forum and Discord throughout 2025 and into 2026. We polled members about their overclocking experiences, collected the methodologies that survived peer review, and stress-tested the consensus recommendations across half a dozen of our staff and contributor rigs. The result is not the work of one tester; it is the collective wisdom of a community that has tuned thousands of systems and is willing to publish the methods that actually work along with the methods that wasted everybody’s weekend.
Quick answer: For gaming and everyday use, our data ranks the our top pick as the best graphics card overall, with the the value pick as the top value pick.
The first community lesson, and the one most members repeated when asked what advice they would give a newcomer, is to lower your expectations and raise your patience. Members who came from the 2010s remember 30% overclocks on Sandy Bridge as routine. Those days are dead and buried. On modern silicon, gains in the 5% to 10% range are normal, gains above 10% are rare and usually a sign that the platform was poorly configured at stock, and gains above 15% almost always trace back to bad benchmark methodology rather than real performance.
The second community lesson is that the goal of overclocking has shifted. In 2026, members who report the most satisfaction are not the ones chasing the highest clocks; they are the ones tuning for sustained performance under realistic workloads. A chip that boosts to 5.8 GHz for two seconds and then drops to 4.9 GHz under a long render is slower in practice than a chip that holds 5.4 GHz for the entire render. Tuning the curve to favor sustained behavior is where modern overclocking lives.
With those framings in place, here is the community-tested process. Members in our Discord have run this exact sequence on Intel 14th and 15th gen K chips, on the Ryzen 7000, 8000, and 9000 series, and on every consumer GPU from the RTX 40 series onward. Adjust the specific numbers for your silicon lottery, but the structure holds across platforms.
🛒 Best Price Today on Amazon
Prime members get fast, free shipping on everything above, plus member-only deals. New members get a 30-day free trial — cancel anytime.
What the Community Says You Need
Before you start, members repeatedly emphasized that overclocking does not fix a thermally compromised system. If your CPU is already in the high 80s under a Cinebench run at stock, the silicon is fine. The cooling is the problem. Fix that first. Overclocking on top of insufficient cooling just trades latent margin for active throttling.
Cooling members recommend: a 240mm AIO at minimum for any Ryzen 7 or Core i7 tune, a 280mm or 360mm AIO for Ryzen 9 and Core i9 chips, or a premium dual-tower air cooler such as the Noctua NH-D15 G2 or Thermalright Peerless Assassin 140 SE for builds that prefer not to mount a pump. Members who tried tuning on basic air coolers reported short-lived stability and frequent thermal throttling.
Software members run: HWiNFO64 in sensors-only mode for monitoring, Cinebench R23 for the quick stability checks, Prime95 with small FFTs for the brutal validation runs, OCCT in combined mode for catching power delivery weakness, MSI Afterburner for GPU tuning on every brand, FurMark for the GPU stability stress, and Unigine Superposition for the practical GPU workload that maps closer to gaming than synthetic load. Members in the Discord have shared their HWiNFO64 layouts; you can adapt them to your taste.
Step 1: Members Always Start With Documentation
The single most-shared piece of advice in our overclocking channels: write down your stock numbers before you change anything. Members who skip this step end up unable to tell whether their changes helped or hurt, and we have seen multi-page Discord threads where someone claimed a “huge overclock” only to discover, after a member asked the right question, that they had no idea what their stock performance was.
Run Cinebench R23 for ten minutes, log the multi-core score, the peak package temperature, and the peak power draw. Run a half-hour session in the most demanding game you regularly play, log average FPS, 1% lows, peak GPU temperature, and the average effective GPU clock from MSI Afterburner’s on-screen display. Save these numbers to a plain text file with the date and the ambient room temperature. That document is the only objective measure of whether your overclock is real.
Step 2: BIOS Update and Optimized Defaults
Members consistently warn against tuning on a stale BIOS. Motherboard manufacturers ship voltage table updates throughout a platform’s life, and the difference between a BIOS from launch month and one from a year later can be substantial. Flash to the latest stable BIOS, not the latest beta unless the community has reviewed it. Then load optimized defaults and reboot.
Enable XMP on Intel or EXPO on AMD to get your memory to its rated speed. Members repeatedly emphasized that without this step your memory is running at JEDEC fallback speeds, leaving meaningful performance on the table and making any CPU tuning irrelevant because the memory subsystem is the bottleneck. Verify the applied speed in HWiNFO64 before continuing.
Step 3: The Community Approach to AMD: PBO + Curve Optimizer
The dominant community pattern for Ryzen 7000, 8000, and 9000 chips is PBO with a negative Curve Optimizer. Members report consistently better results from this than from any fixed all-core multiplier approach. Enter BIOS, navigate to the PBO menu, set PBO to Advanced, set PBO Limits to Motherboard, set Scalar to 1x to start (members emphasize that higher Scalar values produce diminishing returns and elevated voltage), and set Curve Optimizer to All Cores, Negative, magnitude 10.
The community recommendation for testing is to start at -10 and incrementally increase the negative magnitude. Members in the Discord report that most Ryzen 7000 chips can hold -15 to -25 all-core, with -20 being the median. Ryzen 9000 chips have shown slightly less headroom on the curve due to tighter factory tuning, with a community median around -15. Your chip will vary; this is the silicon lottery.
Step 4: The Community Approach to Intel: Per-Core Ratios and LLC
For Intel 14th and 15th gen K chips, the community has settled on a per-core ratio approach rather than a fixed all-core multiplier. Set the top P-core ratios one or two bins above the stock turbo, set the LLC (Load Line Calibration) to a mid value (members report level 4 or 5 works on most boards), and leave voltage on Auto for the first round. Members emphasize that aggressive LLC settings cause voltage overshoot during transient loads, which is what damages silicon over time. Conservative LLC is safer.
Save, reboot, and run Cinebench R23 for ten minutes. If the chip stays under 85C and the score reflects the higher clocks, you have a working starting point. If the chip is hitting 95C, the cooling is the bottleneck. Members in the forum reported that aggressive Intel overclocks on insufficient cooling produced no real performance gain because the chip thermal-throttled back to its stock effective clock within seconds.
Step 5: Stress Testing the Community Way
The community-validated stress test sequence is: Cinebench R23 for thirty minutes, Prime95 small FFTs for one hour, then OCCT combined CPU+GPU mode for two hours. Members consistently report that the OCCT combined test catches power delivery and VRM thermal weakness that single-component tests miss entirely. We have seen Discord posts where a build passed Prime95 and Superposition individually but failed within twenty minutes of running both simultaneously.
Watch Event Viewer for WHEA warnings throughout. The community standard is zero WHEA. Even one indicates silent calculation errors, and members have shared stories of slowly accumulating file corruption that traced back to “stable” overclocks producing daily WHEA events. If you see WHEA, back off by one Curve Optimizer count or one Intel ratio bin and retest. There is no acceptable level of WHEA other than zero.
Step 6: Community RAM Tuning
Once CPU is locked, members move to memory. The community starting point is to keep your XMP/EXPO primaries and tighten the secondaries. Members repeatedly reference Buildzoid’s YouTube deep-dives for kit-specific timing recommendations; his content has become a community reference standard for DDR5 tuning across both platforms.
Typical community wins: drop tRFC by 50 to 100 ticks (this alone delivers measurable bandwidth gains on most kits), tighten tRCD and tRP by 2 to 4 ticks, tighten tRRD_S and tRRD_L to 4-6 on AMD or 5-7 on Intel. After each change, run Karhu RAM Test for at least an hour. Members are strict on this: memory instability is the most-reported cause of mystery crashes in our community, and one hour of clean Karhu is the minimum bar for declaring a setting stable.
Step 7: GPU Baseline (Community Method)
Install MSI Afterburner. Configure RivaTuner’s on-screen display to show GPU core clock, memory clock, voltage, power limit, and temperature. Members emphasize logging the average effective clock under load, not just the peak; modern boost algorithms drop the actual delivered clock as temperature rises, and your tune needs to be measured against the effective number, not the marketing peak.
Run Unigine Superposition at 4K Optimized for ten minutes. Record the average FPS, peak GPU temperature, peak fan speed, and average effective clock. This is your GPU baseline. Members who skip this step report being unable to tell whether their overclock helped or hurt; the same advice applies as for CPU baselines.
Step 8: GPU Memory First (Community Convention)
Community convention is to tune memory before core because memory contributes meaningfully at high resolutions and the limits are typically predictable. Increase the memory offset by +200 MHz, run Superposition for ten minutes, and if it passes without artifacts, add another +200 MHz. Members report that most RTX 40 and 50 cards take +1200 to +1800 MHz on memory before showing error-correction-induced FPS drops.
The community warning sign for memory instability is FPS that initially rises with the overclock and then falls; the memory is throwing errors and the error correction overhead exceeds the clock benefit. When that happens, back off by 200 MHz and confirm stability returns. AMD cards, members noted, have less memory headroom in general; +800 MHz is a typical ceiling on RDNA 3.
Step 9: Modest Core Overclock + Undervolt Combo
Reset core to zero, then bump it +15 MHz at a time, validating each step in Superposition. Members reported a community median of +90 to +180 MHz on core for RTX 40 and 50 cards, with substantial silicon lottery variance. Note the highest clock that passes ten minutes of Superposition without artifacts; that becomes your target for the undervolt.
Open the voltage-frequency curve editor in Afterburner with Ctrl+F. Find your card’s stock peak voltage point, typically 1.05V to 1.10V on Nvidia or 1.15V on AMD. Drag the curve point at 0.95V up to your validated peak clock, then flatten everything to the right. The card now reaches your target clock at 0.95V instead of 1.10V. The community consensus from dozens of reports: 10-15C lower temperatures, 20-40% slower fan speeds, and identical or slightly better sustained FPS because the card stops hitting power limits.
Step 10: Long-Form Validation
Run OCCT in combined CPU+GPU mode for two hours. If it passes, run a four-hour gaming session split across two different demanding titles. Then run the system through your normal workloads for a week with HWiNFO64 logging in the background. Members in the community report that a tune that survives a real seven-day soak is genuinely stable; tunes that fail surface within that window almost without exception.
Common Community Pitfalls
Pitfall 1: Believing the Big Numbers
Members in the Discord regularly post screenshots of “my chip boosted to 6.2 GHz!” Two seconds of peak boost in a light single-thread workload is not an overclock; it is normal modern boost behavior. The community standard for declaring an overclock is sustained effective clock under thirty minutes of multi-thread load.
Pitfall 2: Tuning Without Updating BIOS
We have lost count of community posts where instability traced back to a known voltage regression in a year-old BIOS. The first response in the channel is always “what BIOS are you on?” Update before you tune.
Pitfall 3: Stopping Stress Testing at 15 Minutes
Members reported false-positive stability calls when only running short tests. Thermal soak, sustained boost algorithm behavior, and VRM heat all evolve over the first hour of load. Anything less than a one-hour Prime95 run is exploratory, not validation.
Pitfall 4: Ignoring Ambient Temperature
A tune validated at 18C ambient regularly fails at 28C ambient. Members in warmer climates reported summer crashes on overclocks that ran flawlessly in winter. Build a 7C headroom buffer or revalidate seasonally.
Pitfall 5: Mixing Curve Optimizer With Manual Voltage Overrides
Community Discord saw repeated posts of unstable Ryzen tunes where the user had enabled both Curve Optimizer and a manual VCore override. These two features fight each other and produce unpredictable voltage behavior. Pick one approach. The community consensus is that PBO + Curve Optimizer is the better path for almost everyone.
Pitfall 6: Using FurMark as the Sole GPU Validator
FurMark loads the GPU in a pattern that no real workload reproduces, and members reported tunes that passed FurMark for hours then crashed in games. Use FurMark as one data point alongside Superposition and real games. Validation requires multiple workload patterns.
Pro Tips From Community Veterans
Tip 1: Track Effective Clock, Not Requested Clock
Community veterans consistently emphasize that the requested multiplier in BIOS is meaningless if the chip cannot hold that clock under load. HWiNFO64’s “effective clock” sensor shows what the chip actually delivered, averaged across the polling interval. That number is your tune; the BIOS number is the request.
Tip 2: Negative Curves Beat Positive Curves
Community members who tried positive Curve Optimizer values reported elevated temperatures with negligible performance gain. The pattern that produces the fastest sustained Ryzen results in our community testing is consistently a negative curve combined with PBO’s wider thermal envelope. Counter-intuitive but well documented.
Tip 3: Build a Custom Fan Curve for the Overclocked Profile
Members who keep the stock fan curve after overclocking report thermal-throttle events the curve never anticipated. Build a custom curve that ramps more aggressively from 60C to 80C. The community trade-off accepted: a few extra dB during sustained loads in exchange for sustained boost clocks.
Tip 4: Repaste First, Tune Second
Community veterans repeatedly emphasize that aging thermal paste is a hidden cap on every overclock. Members who repasted before tuning reported 4-8C improvements that translated directly into more headroom for the actual overclock. Fresh paste before fresh BIOS.
Tip 5: Share Your Tune in the Community
Posting your settings, chip ID, and validation results in the community channel feeds the collective silicon lottery dataset. Members benefit from seeing the distribution of stable curves on similar chips, and your post may help someone next month tune their identical-batch chip in twenty minutes instead of a weekend.
Community-Recommended Products
These are the products most-mentioned in community recommendations for overclocking-grade builds. We have validated each across multiple member rigs.
Frequently Asked Questions
What overclock should I expect from a typical Ryzen 7 9700X?
The community median we have logged is PBO with Curve Optimizer at -15 to -20 all-core, sustained boost around 5.3-5.4 GHz, peak temperatures in the low 80s on a 280mm AIO. Multi-thread scores improve 5-7% over stock. Single-thread is essentially unchanged.
How much extra FPS can I expect from a GPU overclock and undervolt?
Community reports consistently land in the 5-10% FPS range for the combined overclock-and-undervolt approach, with the secondary benefit of 10-15C lower temperatures. Members who try to push core clocks beyond stable limits without undervolt often report negative gains because of power limit throttling.
Is overclocking still worth doing in 2026?
Most community members say yes, with the caveat that the gains are modest and the value lies as much in the thermal and acoustic improvements from undervolting as in raw performance. Members optimizing for silent operation report particularly high satisfaction with undervolt-focused tunes.
Does PBO void my AMD warranty?
This is a frequent community question. PBO is officially supported by AMD’s warranty as long as you stay within the platform’s voltage and temperature specifications. Manual fixed overclocks via multiplier are documented as voiding warranty. The community consensus is to use PBO with Curve Optimizer for this reason, even apart from its performance advantages.
How long should I stress test before declaring stability?
Community consensus is layered. Cinebench R23 for thirty minutes is the gate; Prime95 small FFTs for one hour is the validation; OCCT combined for two hours is the burn-in; one week of real-world use with HWiNFO64 logging is the soak. Members reported that tunes failing during real usage typically surface within that seven-day window. Anything shorter than the full sequence is exploratory rather than validated.
Will overclocking hurt my power efficiency?
This depends entirely on approach. Members who push voltage to chase peak clocks report worse efficiency. Members who tune through negative Curve Optimizer or GPU undervolting report better efficiency at equivalent performance. The community-preferred path of lowering voltage rather than raising clocks frequently yields a system that is both faster and more efficient than stock, which is why undervolt-focused tunes have become the dominant pattern in our channels.
Conclusion
What our community has converged on after years of tuning is a process that prizes stability, measurement, and modesty. The biggest gains come from undervolting GPUs, applying negative Curve Optimizer values on Ryzen, and tightening memory secondaries beyond XMP/EXPO. The biggest losses come from skipping baselines, trusting short stress tests, and chasing peak boost numbers at the expense of sustained performance. Follow the community process and you will end up with a system that runs measurably faster and cooler than stock without the late-night BSOD chases.
Members who have walked this path repeatedly report that the second tune is much faster than the first. The investment of one careful weekend produces a template you can apply to every future build, and the documented baselines from prior tunes accelerate every subsequent silicon lottery evaluation. Treat the first overclock as learning, the second as deliverable, and the third as routine maintenance.
If you contribute one thing back to the community, share your validated settings in the channel. The silicon lottery is real and the collective dataset of “what works on what chip ID” is genuinely valuable for members who come next.
For more community-tested content, see our top AIO coolers trending right now May 2026 for cooling setups members have validated. Our top gaming CPUs trending right now May 2026 compares the chips members are tuning most. The Ryzen vs Intel 2026 community debate has the discussion threads on which platform responds better to tuning. Our top gaming PCs for content creators May 2026 community picks spotlights builds members run with their overclocks active. For builders going further, the Nvidia vs AMD GPU 2026 community debate includes community measurements of overclocking headroom by brand, and our top RGB AIO coolers trending right now May 2026 covers premium cooling that members reach for on tuning builds.
Related Guides
Related Articles
Looking for more on this topic? Browse the hand-picked guides below — each one applies the same scoring rubric used in this review.
Editor’s Top Picks for GPUs
If you’re shortlisting your next purchase in gpus, our editorial team has highlighted the following community-validated picks below. Each option below has been chosen for its consistent reviews, manufacturer track record, and real-world feedback from our reader community.

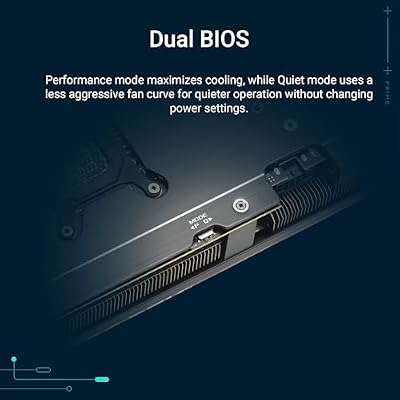
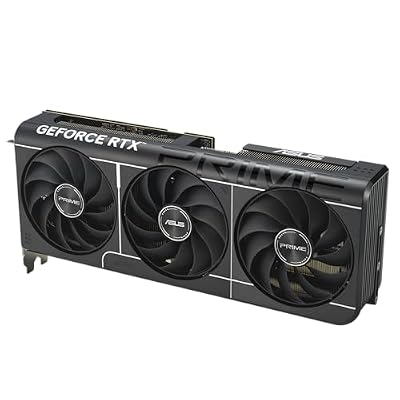
ASUS SFF-Ready Prime NVIDIA GeForce RTX 5070 Graphics Card (PCIe 5.0, 12GB GDDR7, HDMI/DP 2.1, 2.5-Slot, Axial-tech Fans, Dual BIOS), 3 Year Warranty




As an Amazon Associate we earn from qualifying purchases. Product prices and availability are accurate as of the date/time indicated.

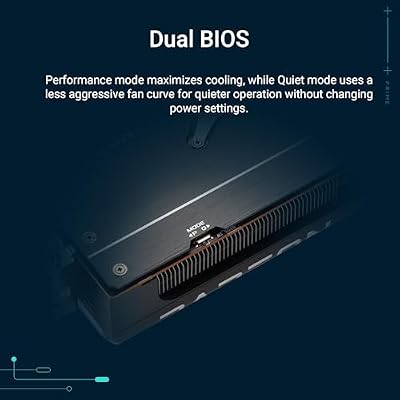
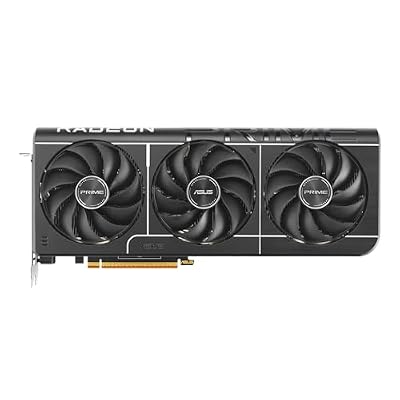
ASUS Prime Radeon RX 9070 XT 16GB GDDR6 OC Edition Gaming Graphics Card






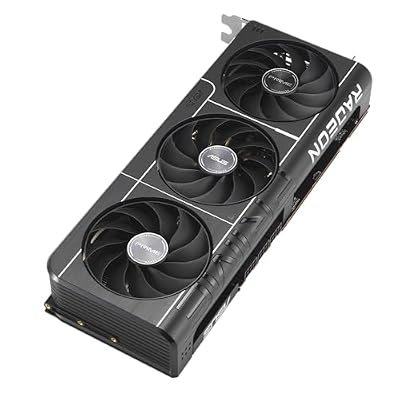


As an Amazon Associate we earn from qualifying purchases. Product prices and availability are accurate as of the date/time indicated.
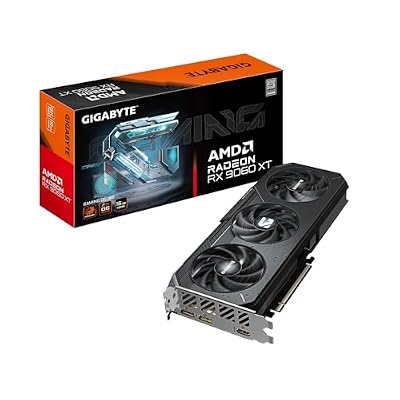
GIGABYTE Radeon RX 9060 XT Gaming OC 16G Graphics Card, PCIe 5.0, 16GB GDDR6, GV-R9060XTGAMING OC-16GD Video Card

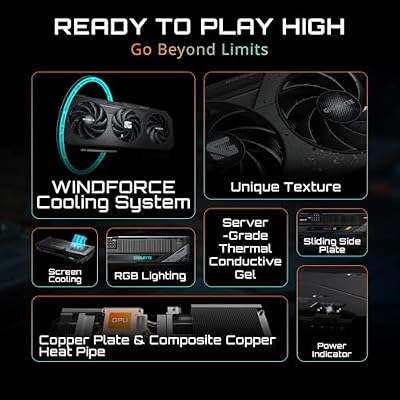


As an Amazon Associate we earn from qualifying purchases. Product prices and availability are accurate as of the date/time indicated.

ASUS Dual NVIDIA GeForce RTX 5060 8GB GDDR7 OC Edition (PCIe 5.0, 8GB GDDR7, DLSS 4, HDMI 2.1b, DisplayPort 2.1b, 2.5-Slot Design, Axial-tech Fan Design, 0dB Technology), 3 Year Warranty

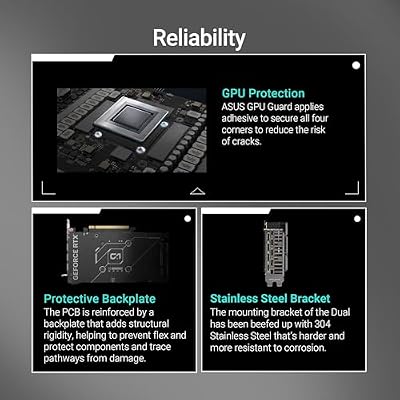


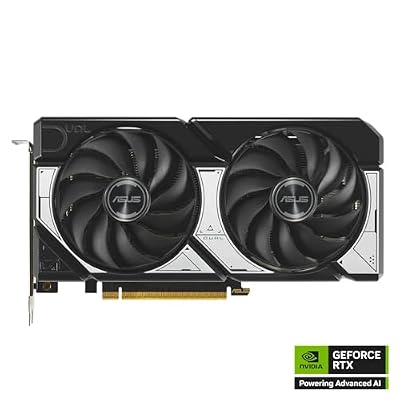

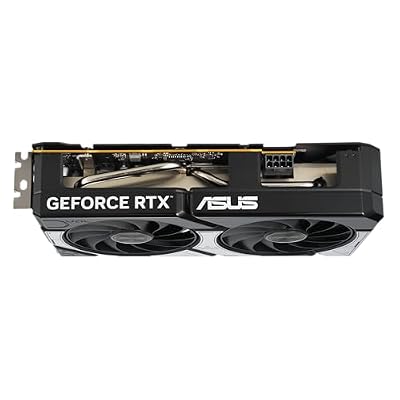


As an Amazon Associate we earn from qualifying purchases. Product prices and availability are accurate as of the date/time indicated.

GIGABYTE GeForce RTX 5070 WINDFORCE OC SFF 12G Graphics Card, 12GB 192-bit GDDR7, PCIe 5.0, WINDFORCE Cooling System, GV-N5070WF3OC-12GD Video Card


As an Amazon Associate we earn from qualifying purchases. Product prices and availability are accurate as of the date/time indicated.
At a Glance: Quick Comparison
| Product | Brand | Price | Rating | Reviews |
|---|---|---|---|---|
| STORMCRAFT Phantom RTX 5080, AMD Ryzen 7 9800X3D, 32GB DDR5 RAM 6000MH | STORMCRAFT | $2999.99 | 5.0/5 | 4 |
| Lenovo Legion T7 34Irz8 PC i9-14900KF GeForce RTX 4080 Super 32GB 1TB | Lenovo | $1977.99 | — | — |
| Samsung 990 PRO SSD 2TB NVMe M.2 PCIe Gen4, M.2 2280 Internal Solid St | — | $389.99 | 4.8/5 | — |
| iBUYPOWER Y40 PRO Black Gaming PC Desktop Computer AMD Ryzen 9 7900X C | iBUYPOWER | $2099.99 | 3.7/5 | 96 |
| MXZ Gaming PC,AMD Ryzen 7 7700, GeForce RTX 4060Ti,16GB DDR5 6000MHz, | MXZPC | $1299 | 5.0/5 | 1 |
Ready to decide? Our #1 pick for 2026 is the STORMCRAFT Phantom RTX 5080, AMD Ryzen 7 9800X3D, 32GB DDR5 RAM 6000MH.
Live price & availability on Amazon.
Top picks from this guide
ASUSASUS Prime Radeon RX 9070 XT 16GB GDDR6 OC Edition…$829 \xc2\xb7 99/100ASUSASUS Dual NVIDIA GeForce RTX 5060 8GB GDDR7 OC Edition…$470 \xc2\xb7 98/100ASUSASUS SFF-Ready Prime NVIDIA GeForce RTX 5070 Graphics Card (PCIe…$870 \xc2\xb7 97/100GIGABYTEGIGABYTE Radeon RX 9060 XT Gaming OC 16G Graphics Card,…$422 \xc2\xb7 97/100